
File:Genotype-by-environment-AMMI-GGE-biplots-Malosetti-2013.jpg
File on Landrace.wiki
More actions
Size of this preview: 800 × 362 pixels. Other resolution: 1,280 × 579 pixels.
Original file (1,280 × 579 pixels, file size: 133 KB, MIME type: image/jpeg)
Summary
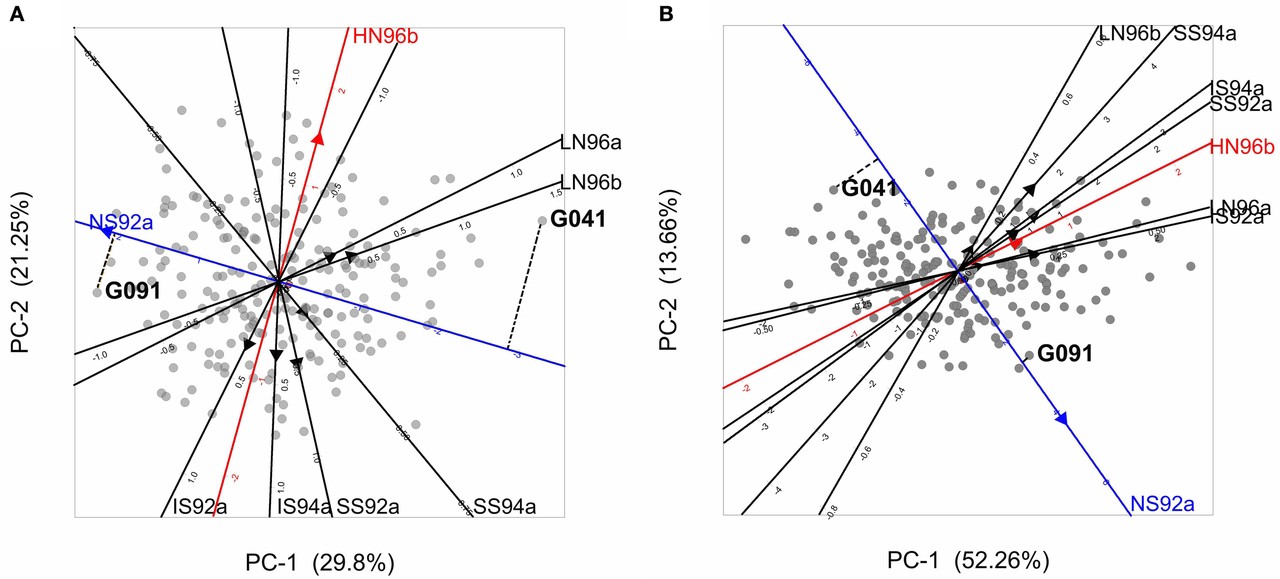
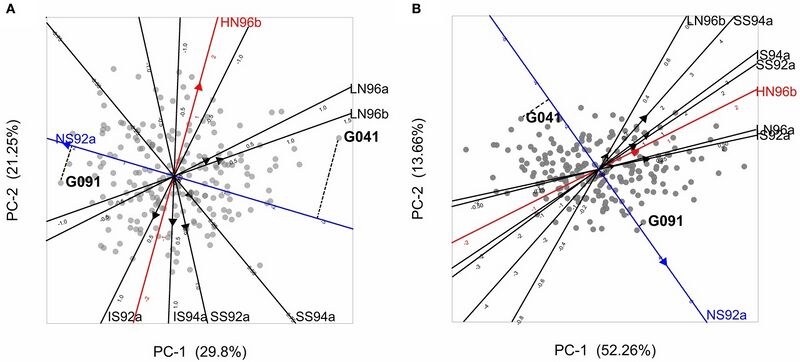
AMMI biplot (A) and GGE biplot (B) of maize trials under drought and nitrogen stress. Grey dots are genotypes, and lines through the centre are environments marked with trial codes. Two genotypes, G041 and G091, are projected on the axis of one environment.
Source
- Original: Malosetti M, Ribaut J-M, van Eeuwijk FA (2013). "The statistical analysis of multi-environment data: modeling genotype-by-environment interaction and its genetic basis". Frontiers in Physiology 4: 44, Figure 4, doi:10.3389/fphys.2013.00044. Published under a Creative Commons Attribution 3.0 licence.
Licensing

Creative Commons Attribution 3.0 Unported
This file is licensed under the CC BY 3.0 licence.
You are free to: Share and adapt for any purpose, even commercially.
You must: Give appropriate credit, provide a link to the licence, and indicate if changes were made.
File history
Click on a date/time to view the file as it appeared at that time.
| Date/Time | Thumbnail | Dimensions | User | Comment | |
|---|---|---|---|---|---|
| current | 20:51, 6 November 2026 | | 1,280 × 579 (133 KB) | Eloise Zomia (talk | contribs) | AMMI and GGE biplots of maize trials, Figure 4 of Malosetti and colleagues 2013 (CC BY 3.0) |
You cannot overwrite this file.
File usage
The following page uses this file:
