File:Cannabis-genetic-structure.jpg
More actions
Original file (4,200 × 3,296 pixels, file size: 1.33 MB, MIME type: image/jpeg)
Summary
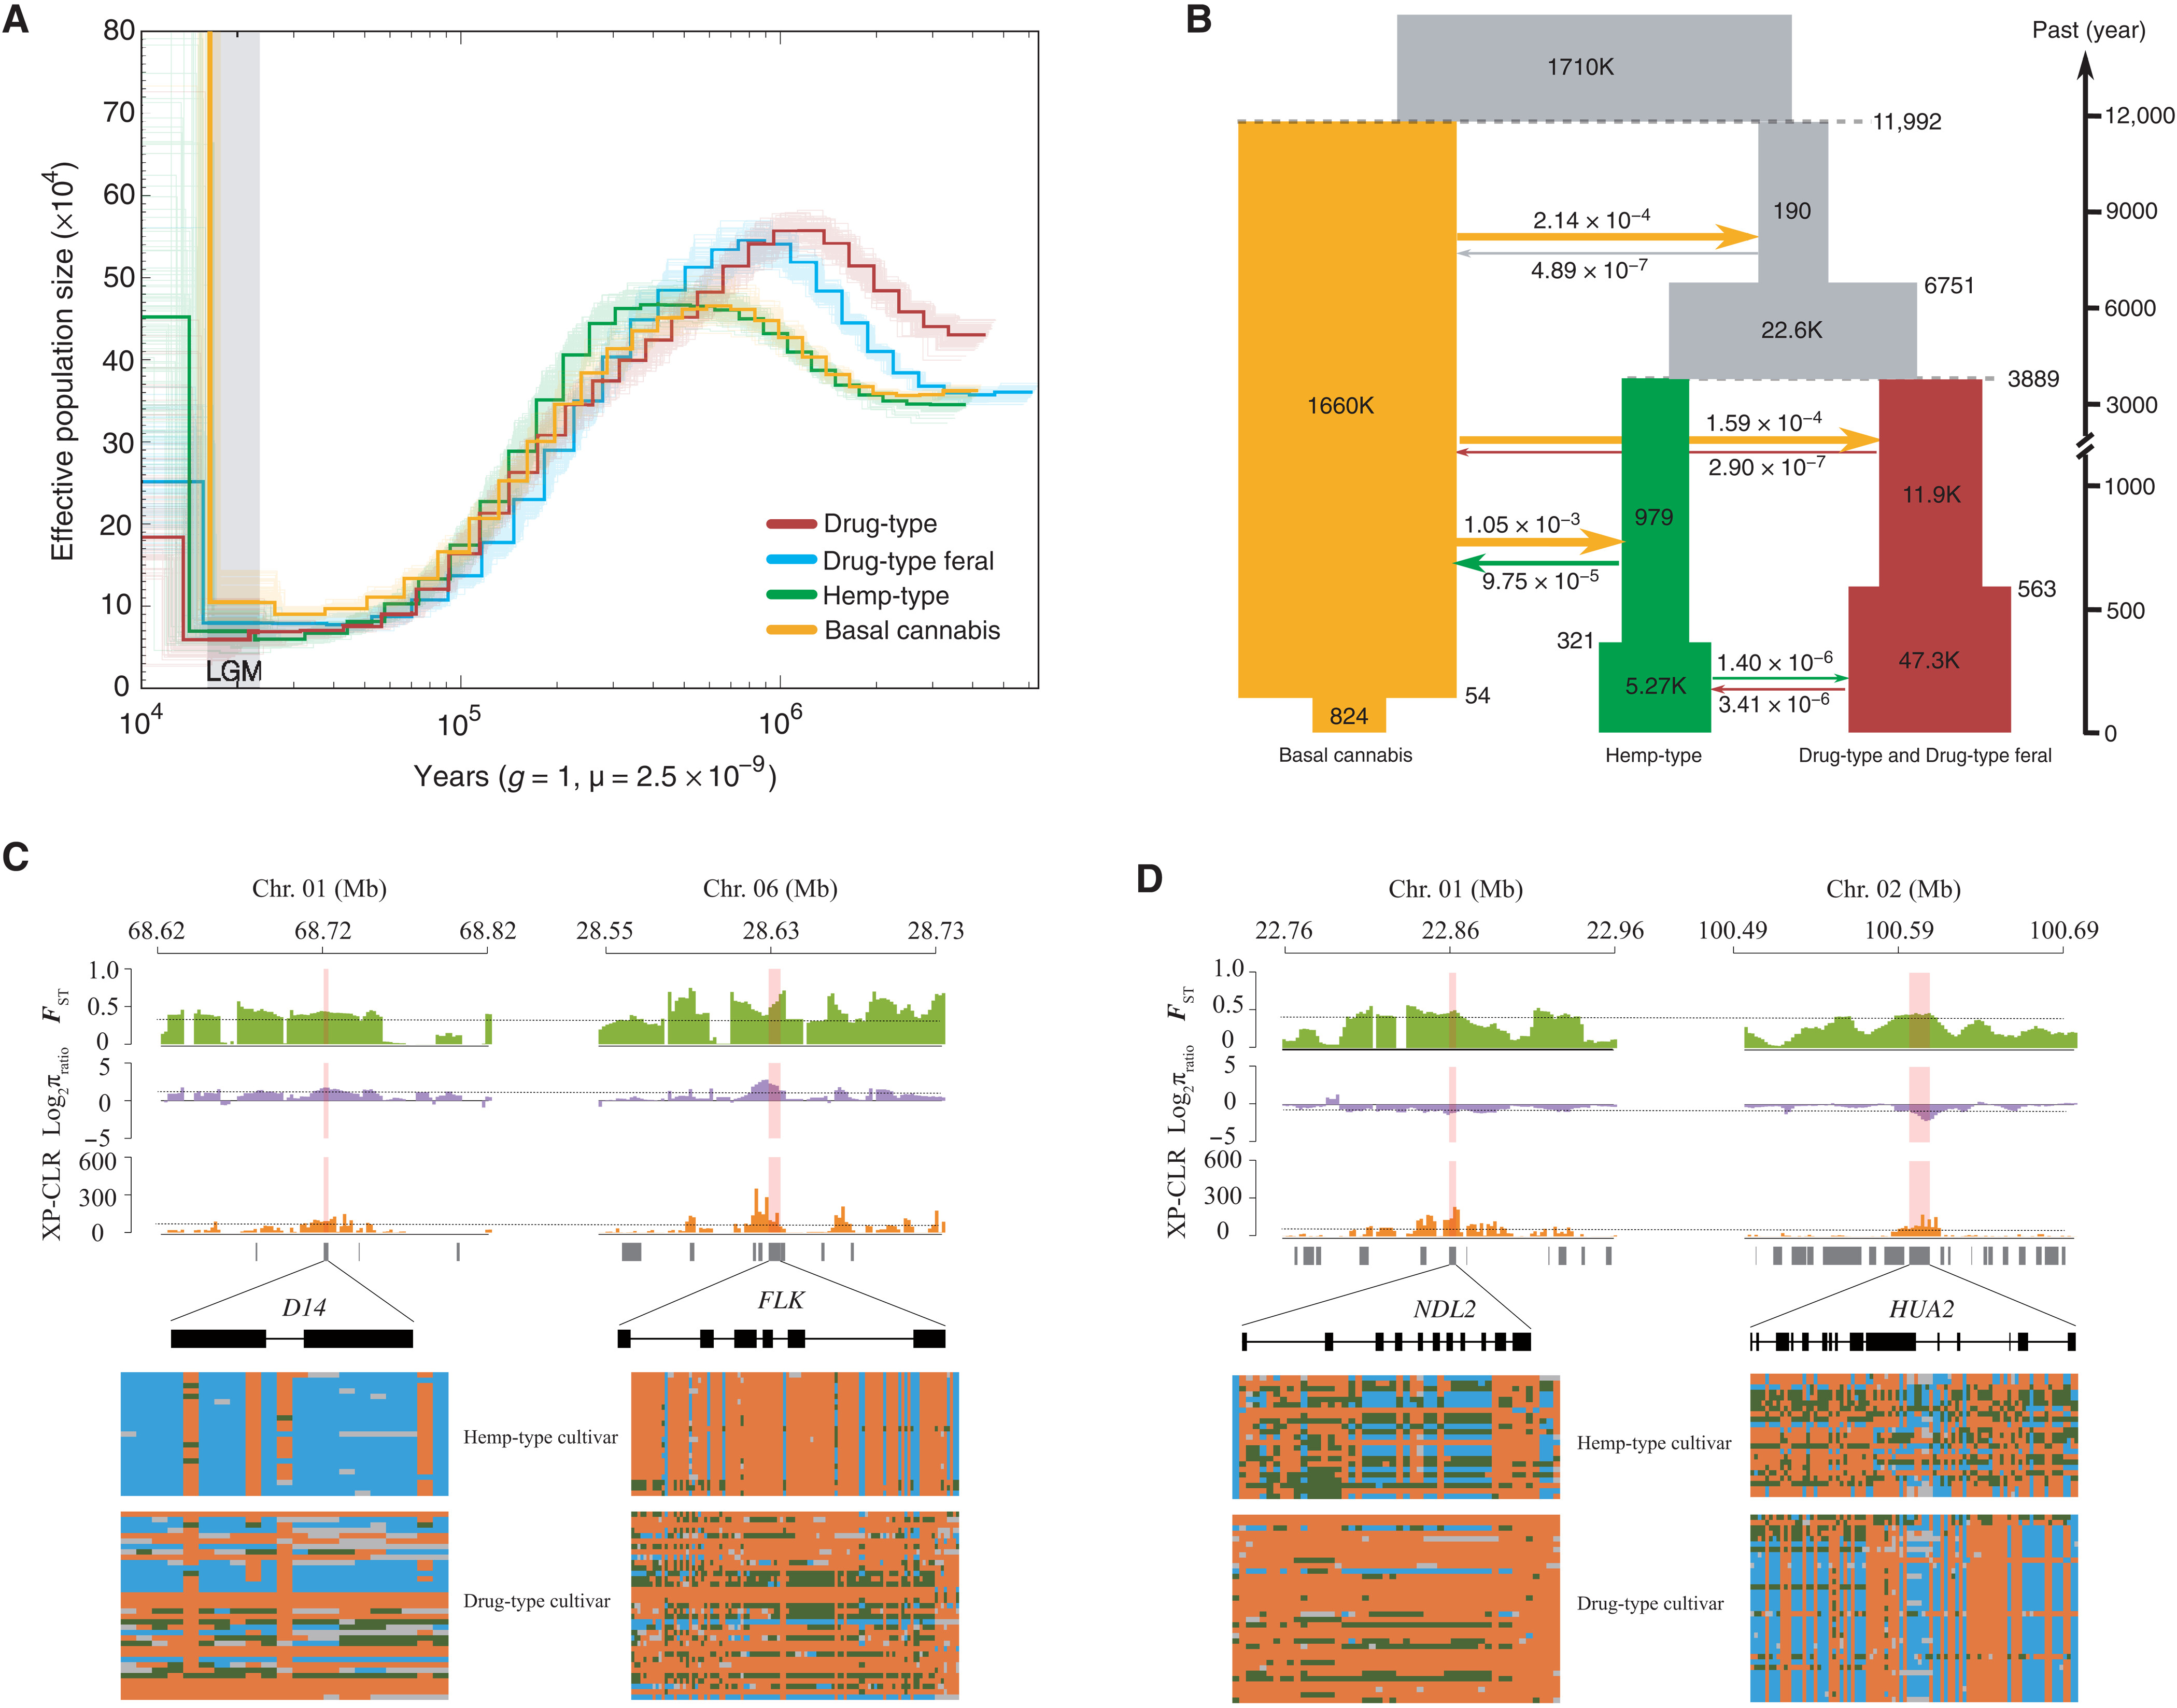
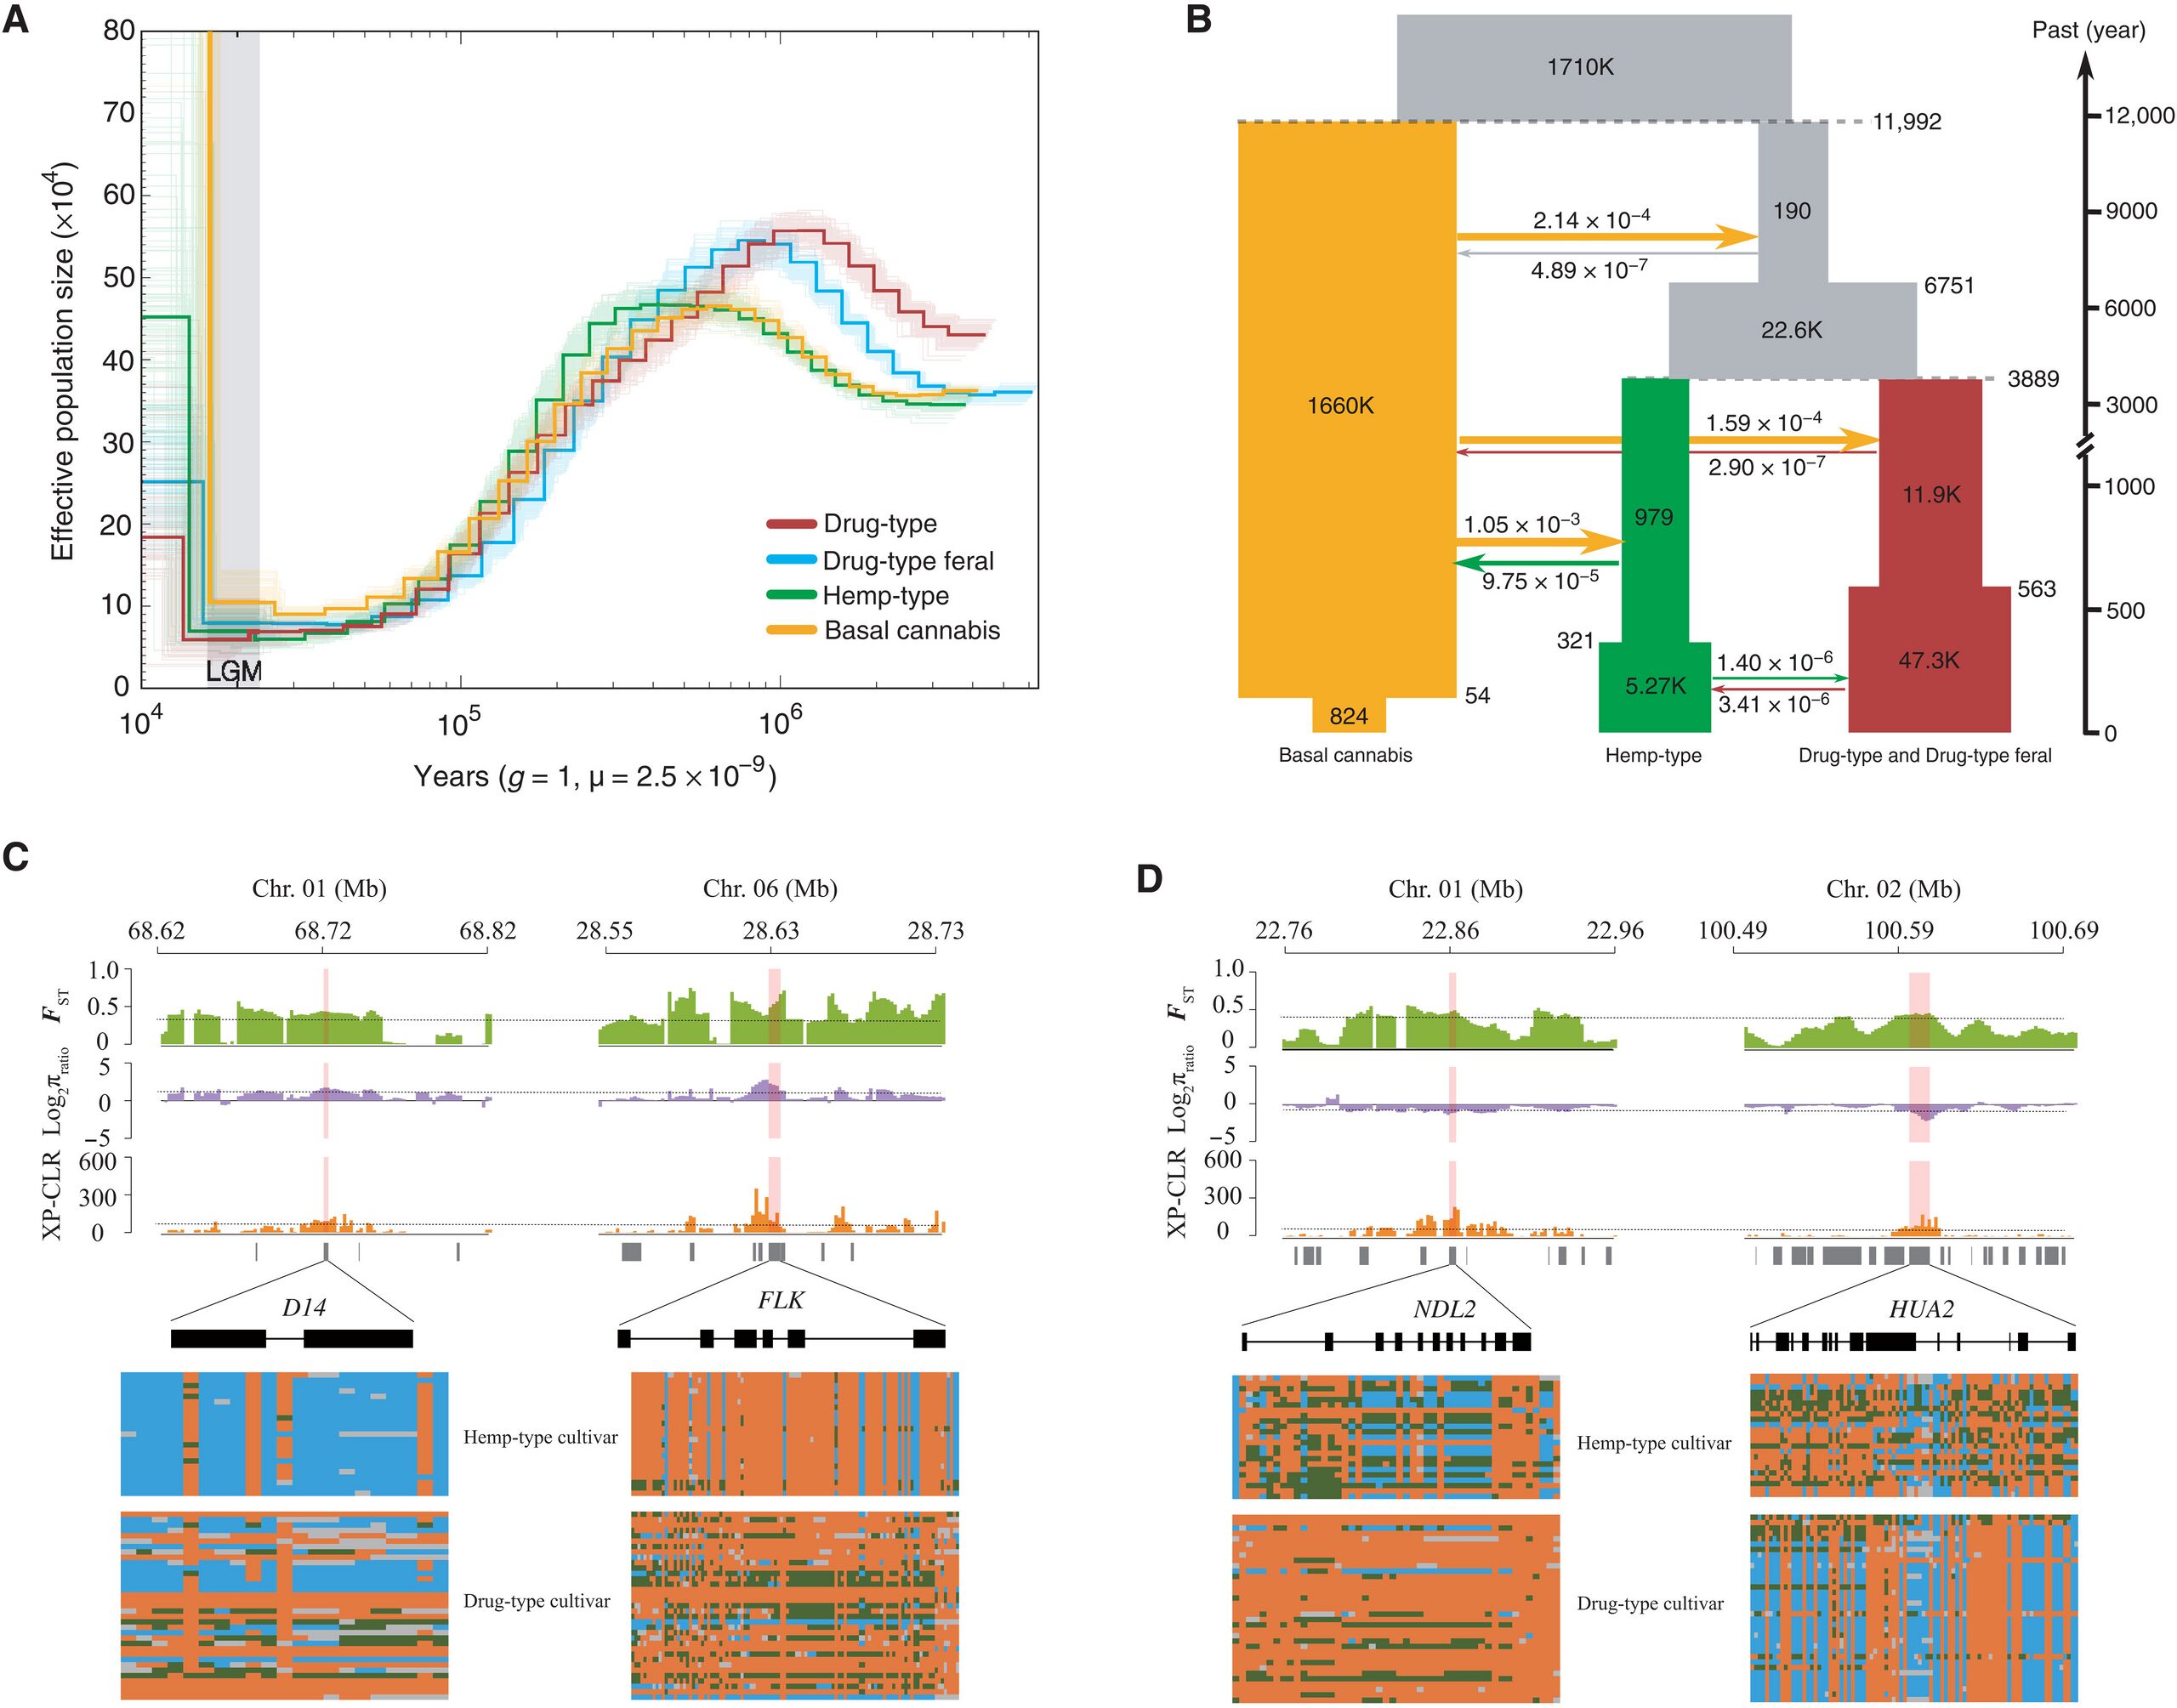
Demographic history of C. sativa and selection signatures identified from comparison between hemp- and drug-type cultivars. (A) Demographic history inferred from the PSMC method (30). (B) Graphical summary of the best-fitting demographic model inferred by fastsimcoal2 (65). Widths show the relative effective population sizes (Ne). Arrows and figures at the arrows indicate the average number of migrants per generation among different groups. The point estimates and 95% confidence intervals of demographic parameters are shown in table S3. Examples of genes with selection sweep signals in hemp-type cultivars (C) and drug-type cultivars (D). Three independent sets of signals (FST, π ratio, and XP-CLR) are shown along the genomic regions covering the four genes. Dashed lines represent the top 5% of the corresponding values. Below the three plot schemes are the gene models in the genomic regions. Below each gene model are the SNP allele distributions along each of the four genes for the two groups (green, heterozygous site; orange, homozygous site of reference allele; blue, homozygous site of alternative allele; gray, missing data).
Licensing
- News reporting and documentation
- Commentary and criticism
- Educational purposes
- Research and scholarship
Important: Fair use rationale must be provided in the file description. This file should not be reused outside this context without permission from the copyright holder.
File history
Click on a date/time to view the file as it appeared at that time.
| Date/Time | Thumbnail | Dimensions | User | Comment | |
|---|---|---|---|---|---|
| current | 08:45, 5 July 2026 | | 4,200 × 3,296 (1.33 MB) | Eloise Zomia (talk | contribs) | Demographic history of C. sativa and selection signatures identified from comparison between hemp- and drug-type cultivars. (A) Demographic history inferred from the PSMC method (30). (B) Graphical summary of the best-fitting demographic model inferred by fastsimcoal2 (65). Widths show the relative effective population sizes (Ne). Arrows and figures at the arrows indicate the average number of migrants per generation among different groups. The point estimates and 95% confidence intervals of... |
You cannot overwrite this file.
File usage
The following page uses this file: