File:Cannabis-domestication-origin.jpg
More actions

Original file (3,000 × 3,409 pixels, file size: 848 KB, MIME type: image/jpeg)
Summary
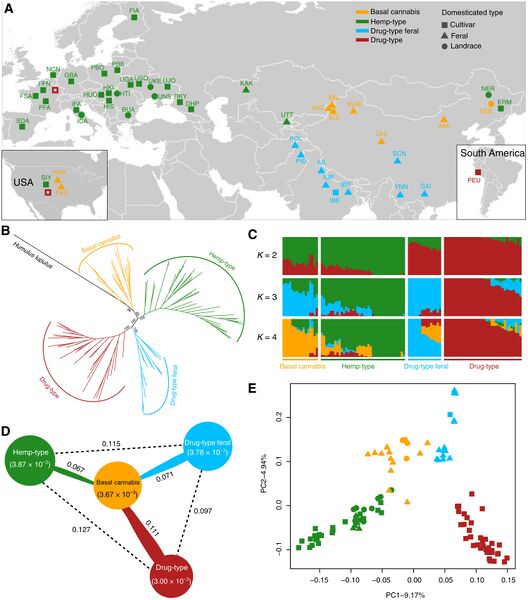
Population structure of Cannabis accessions.
(A) Geographic distribution (i.e., sampling sites of feral plants or country of origin of landraces and cultivars) of the samples analyzed in this study. Color codes correspond to the four groups obtained in the phylogenetic analysis and shapes indicate domestication types. The two empty red squares symbolize drug-type cultivars obtained from commercial stores located in Europe and the United States. For sample codes, see table S1. (B) Maximum likelihood phylogenetic tree based on single-nucleotide polymorphisms (SNPs) at fourfold degenerate sites, using H. lupulus as outgroup. Bootstrap values for major clades are shown. (C) Bayesian model–based clustering analysis with different number of groups (K = 2 to 4). Each vertical bar represents one Cannabis accession, and the x axis shows the four groups. Each color represents one putative ancestral background, and the y axis quantifies ancestry membership. (D) Nucleotide diversity and population divergence across the four groups. Values in parentheses represent measures of nucleotide diversity (π) for the group, and values between pairs indicate population divergence (FST). (E) Principal component analysis (PCA) with the first two principal components, based on genome-wide SNP data. Colors correspond to the phylogenetic tree grouping.
Licensing
- News reporting and documentation
- Commentary and criticism
- Educational purposes
- Research and scholarship
Important: Fair use rationale must be provided in the file description. This file should not be reused outside this context without permission from the copyright holder.
File history
Click on a date/time to view the file as it appeared at that time.
| Date/Time | Thumbnail | Dimensions | User | Comment | |
|---|---|---|---|---|---|
| current | 08:42, 5 July 2026 | | 3,000 × 3,409 (848 KB) | Eloise Zomia (talk | contribs) | Population structure of Cannabis accessions. (A) Geographic distribution (i.e., sampling sites of feral plants or country of origin of landraces and cultivars) of the samples analyzed in this study. Color codes correspond to the four groups obtained in the phylogenetic analysis and shapes indicate domestication types. The two empty red squares symbolize drug-type cultivars obtained from commercial stores located in Europe and the United States. For sample codes, see table S1. (B) Maximum lik... |
You cannot overwrite this file.
File usage
The following page uses this file: