
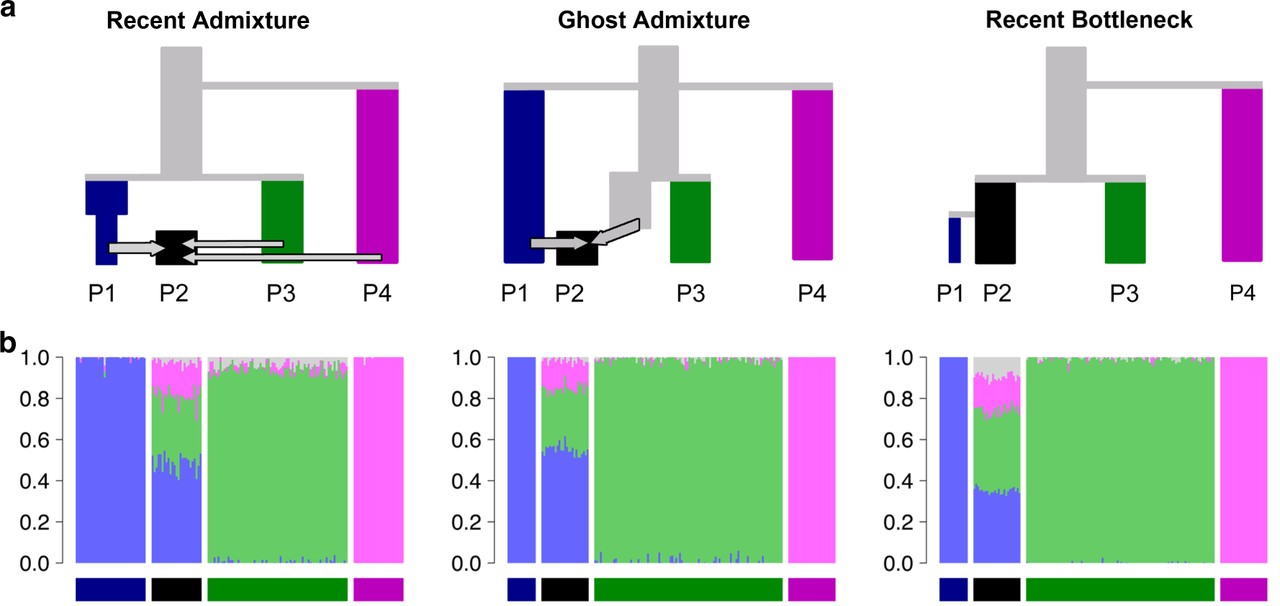
File:Admixture-bar-plots-three-histories-Lawson-2018.jpg
File on Landrace.wiki
More actions
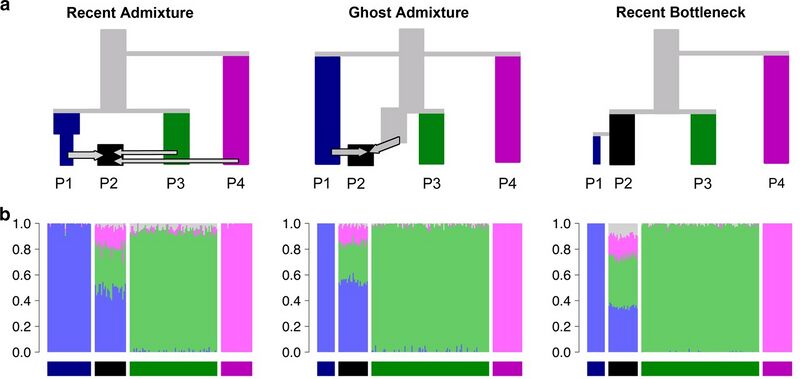
Size of this preview: 800 × 379 pixels. Other resolution: 1,280 × 606 pixels.
Original file (1,280 × 606 pixels, file size: 93 KB, MIME type: image/jpeg)
Summary
Three simulated histories of populations P1 to P4, recent admixture, admixture with an unsampled population and a recent bottleneck, with the ADMIXTURE plot each gives.
Used in Population structure.
Source
- Original: Lawson DJ, van Dorp L, Falush D (2018). "A tutorial on how not to over-interpret STRUCTURE and ADMIXTURE bar plots". Nature Communications 9: 3258, Figure 2, doi:10.1038/s41467-018-05257-7. Published under a Creative Commons Attribution 4.0 licence.
- Changes: Cropped to panels a and b.
Licensing

Creative Commons Attribution 4.0 International
This file is licensed under the CC BY 4.0 license.
You are free to: Share and adapt for any purpose, even commercially.
You must: Give appropriate credit and indicate if changes were made.
File history
Click on a date/time to view the file as it appeared at that time.
| Date/Time | Thumbnail | Dimensions | User | Comment | |
|---|---|---|---|---|---|
| current | 08:18, 7 November 2026 | | 1,280 × 606 (93 KB) | Eloise Zomia (talk | contribs) | Three simulated histories and their ADMIXTURE plots, Figure 2 of Lawson and colleagues 2018 (CC BY 4.0) |
You cannot overwrite this file.
File usage
The following page uses this file:
